
How to Read an AI Visibility Study
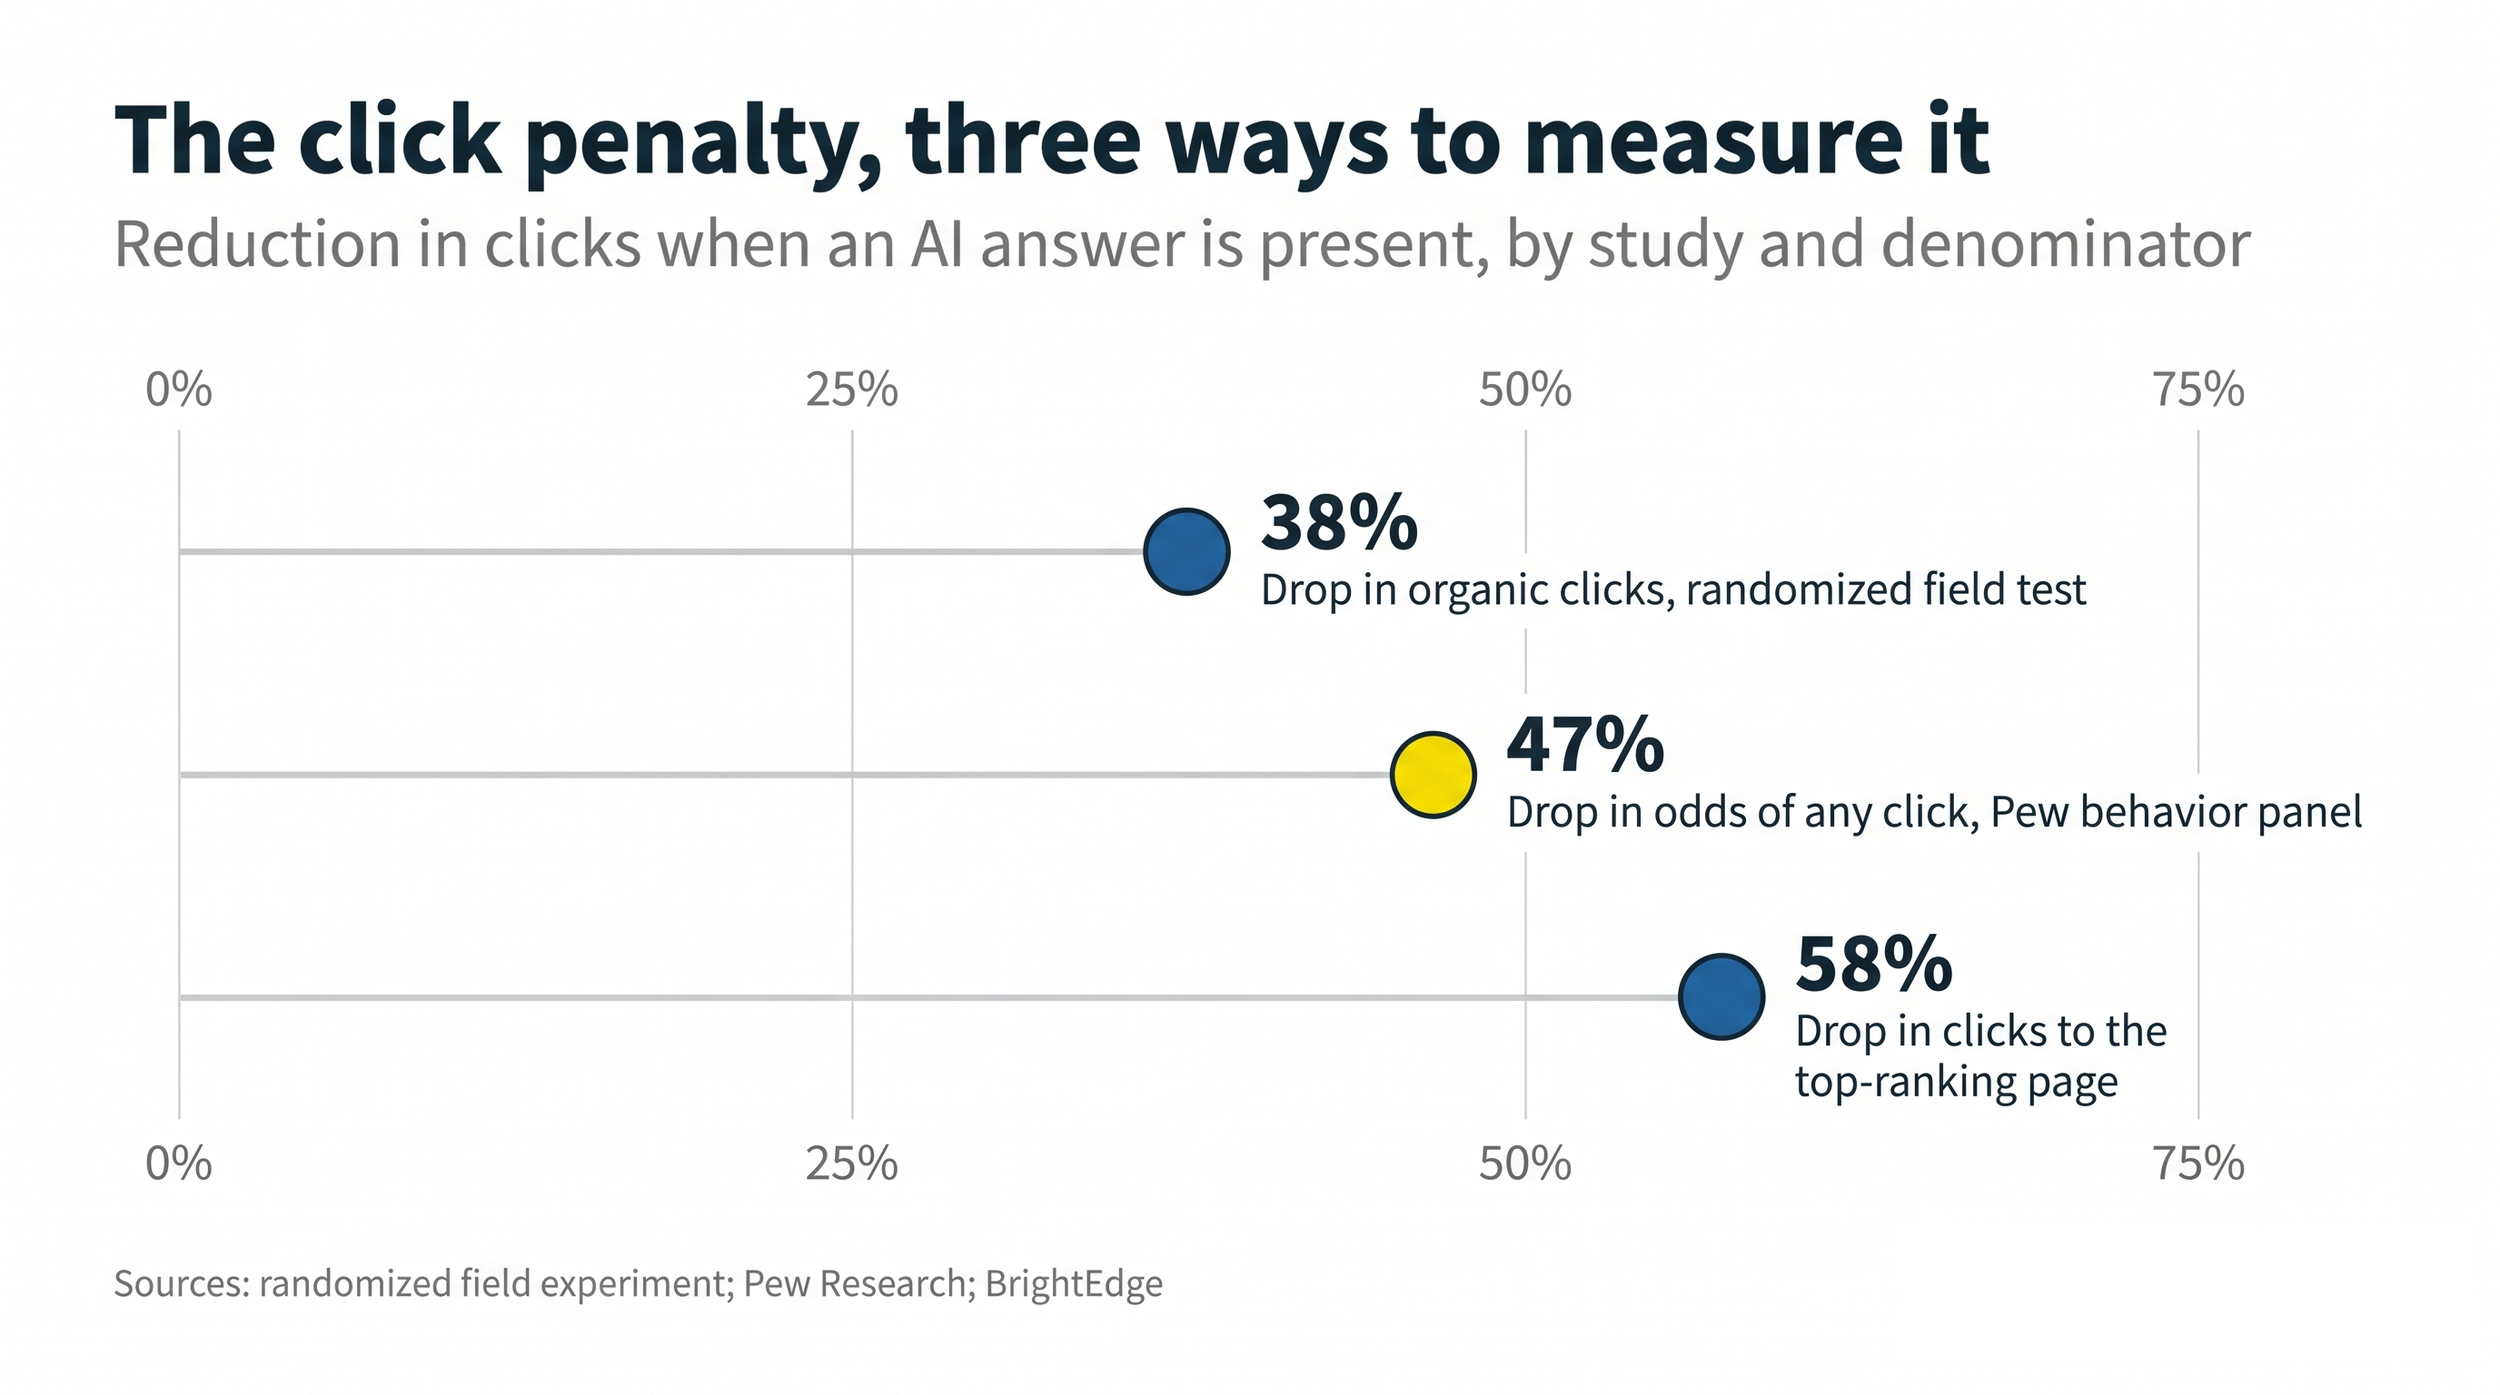
Somewhere in your last quarterly deck, there's a slide with one AI search statistic on it. Maybe it says 38% of AI Overview citations come from top-ten rankings. Maybe it says 80% of cited URLs don't rank in Google's top 100. Maybe it's a conversion multiple, 4.4x, or a scary click number. Whichever one you picked, a different study, run by a credible team with a defensible method, puts that same number somewhere else by a factor of two to four and your competitor's deck probably has the other one.
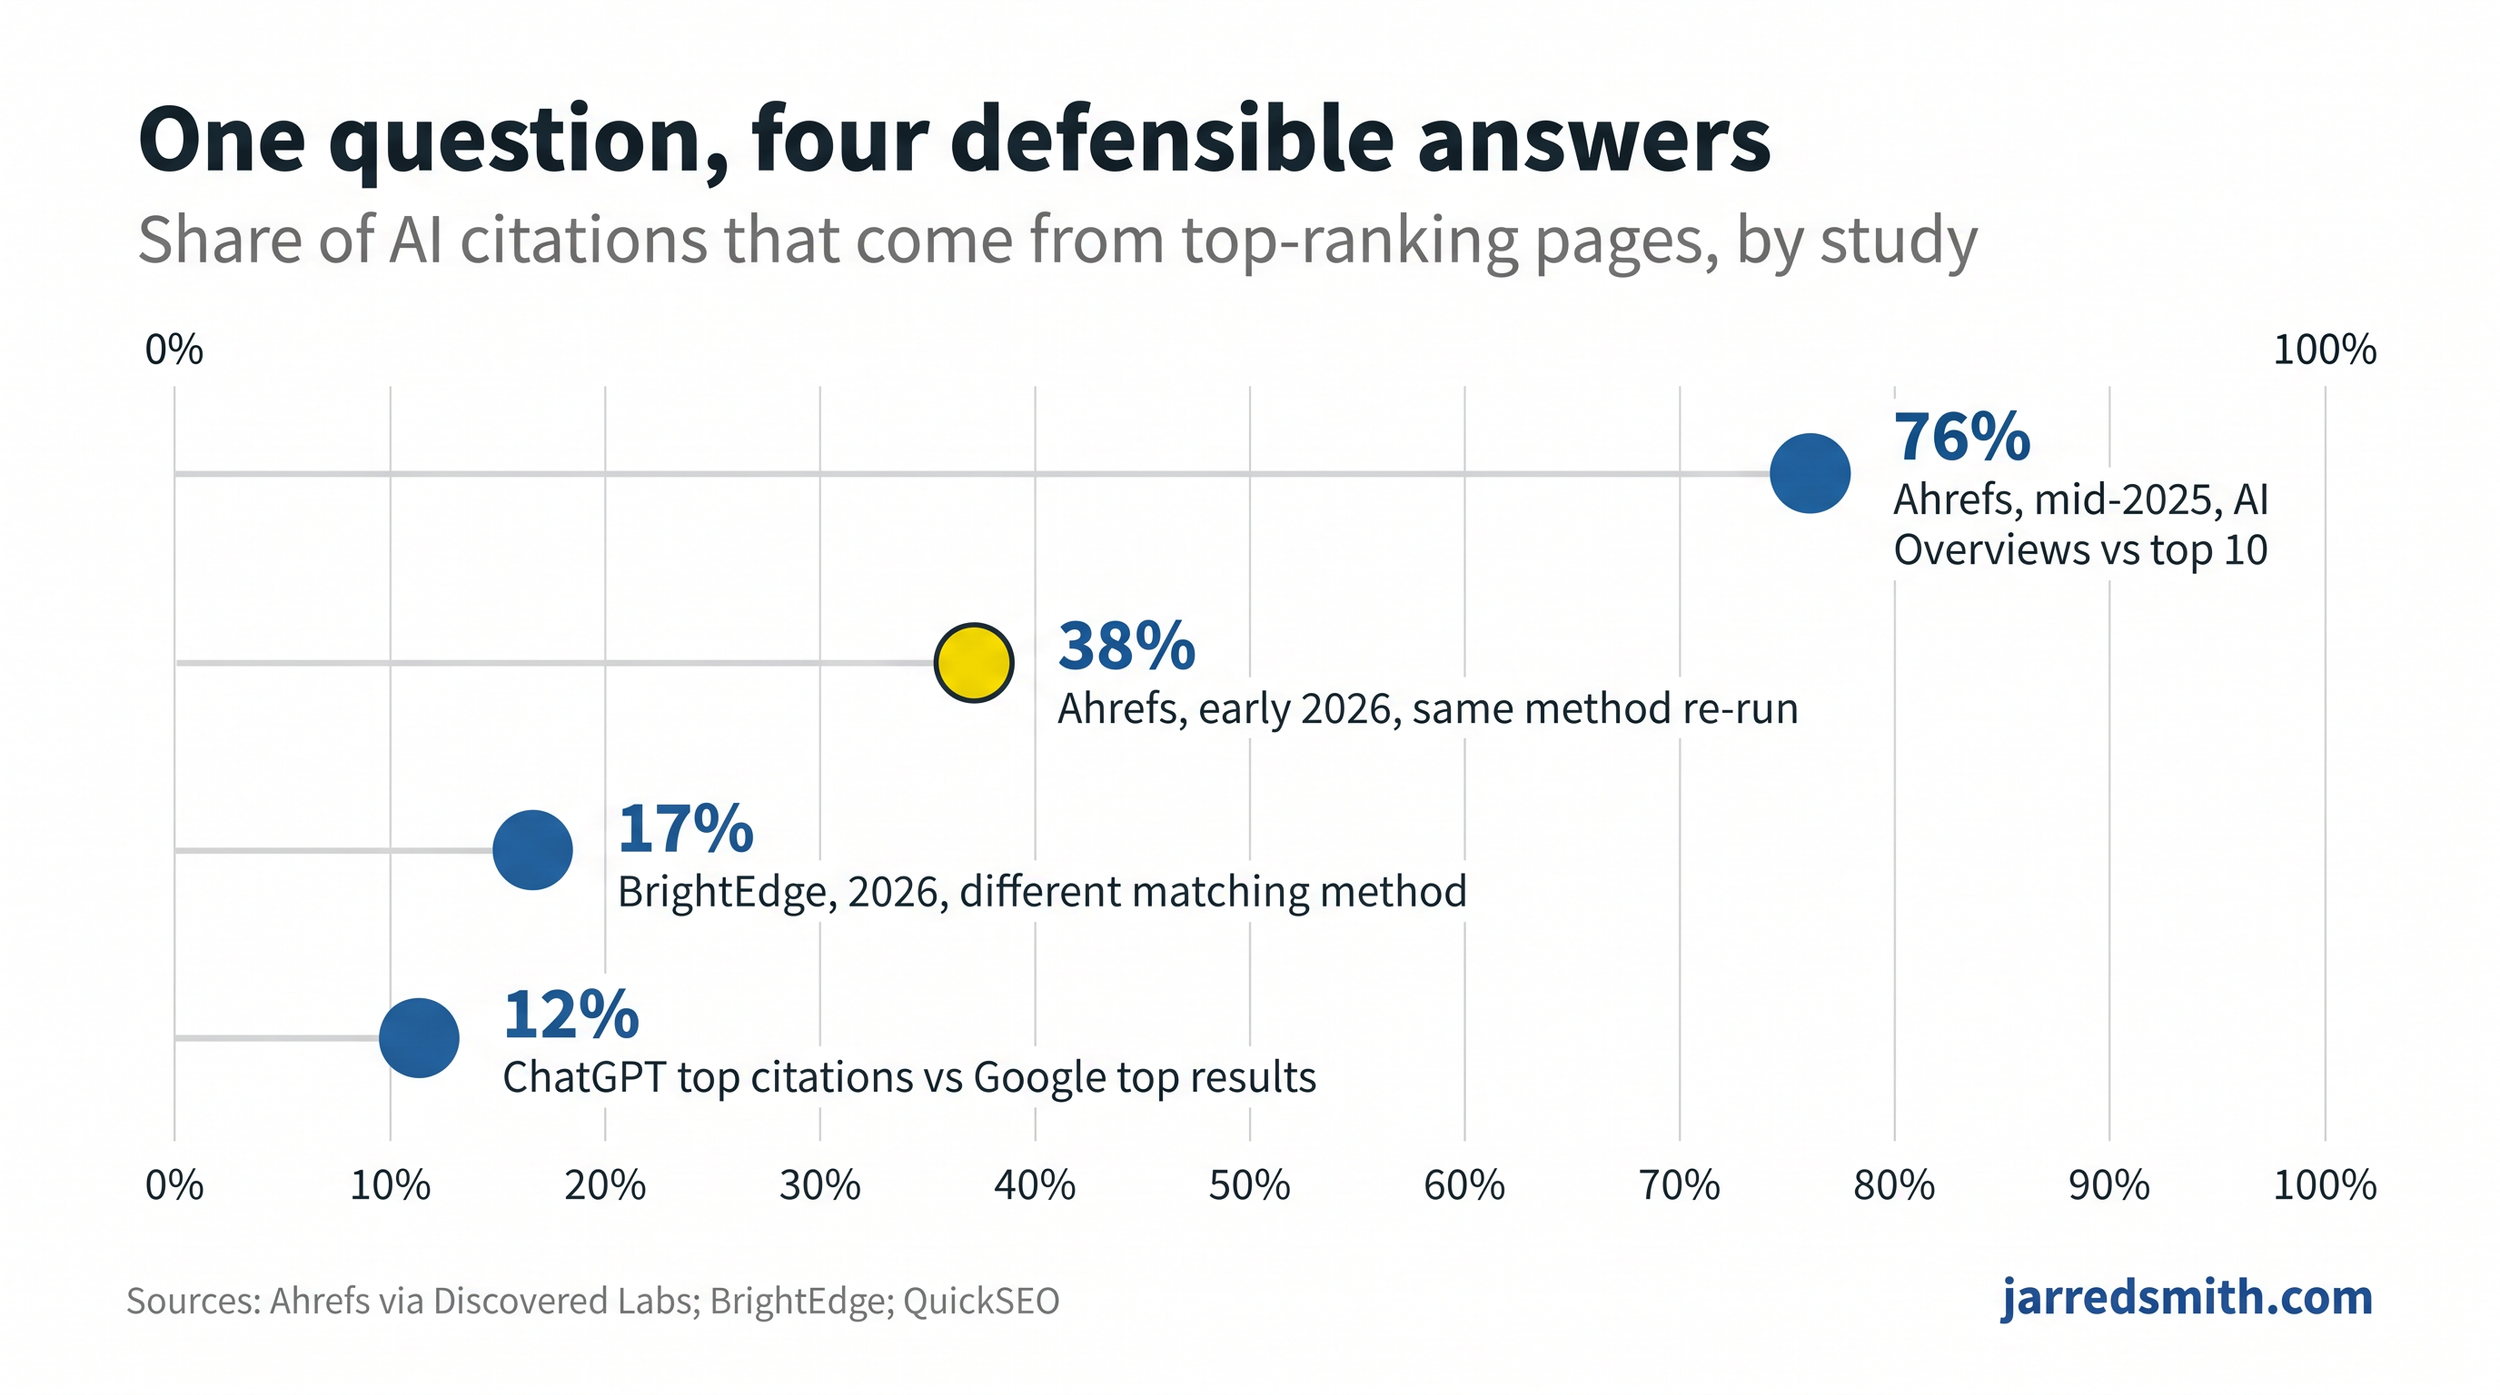
I've spent this year citing these studies one at a time, and my own archive carries the contradiction. In April I wrote that only 38 percent of AI Overview citations come from top-ten organic results, down from 76 seven months earlier. Ten days later I cited research showing 80 percent of LLM-cited URLs don't rank in Google's top 100. BrightEdge puts the top-ten overlap near 17 percent. Every one of those is published and checkable, and a someone looking at all of them has no idea what to believe. That reader deserves better than another number, so this post is the piece I've wanted somebody to write all year. How do you read these studies, why honest ones disagree by multiples, and which number applies to your situation.
The spread
Line up the published answers to the industry's core questions and the disagreement turns into a fairly visible pattern.
Take the overlap question, which is the one that decides how much of your SEO effort carries over into AI answers. The published range runs from 12 to 76 percent depending on the study, the engine, and the date.
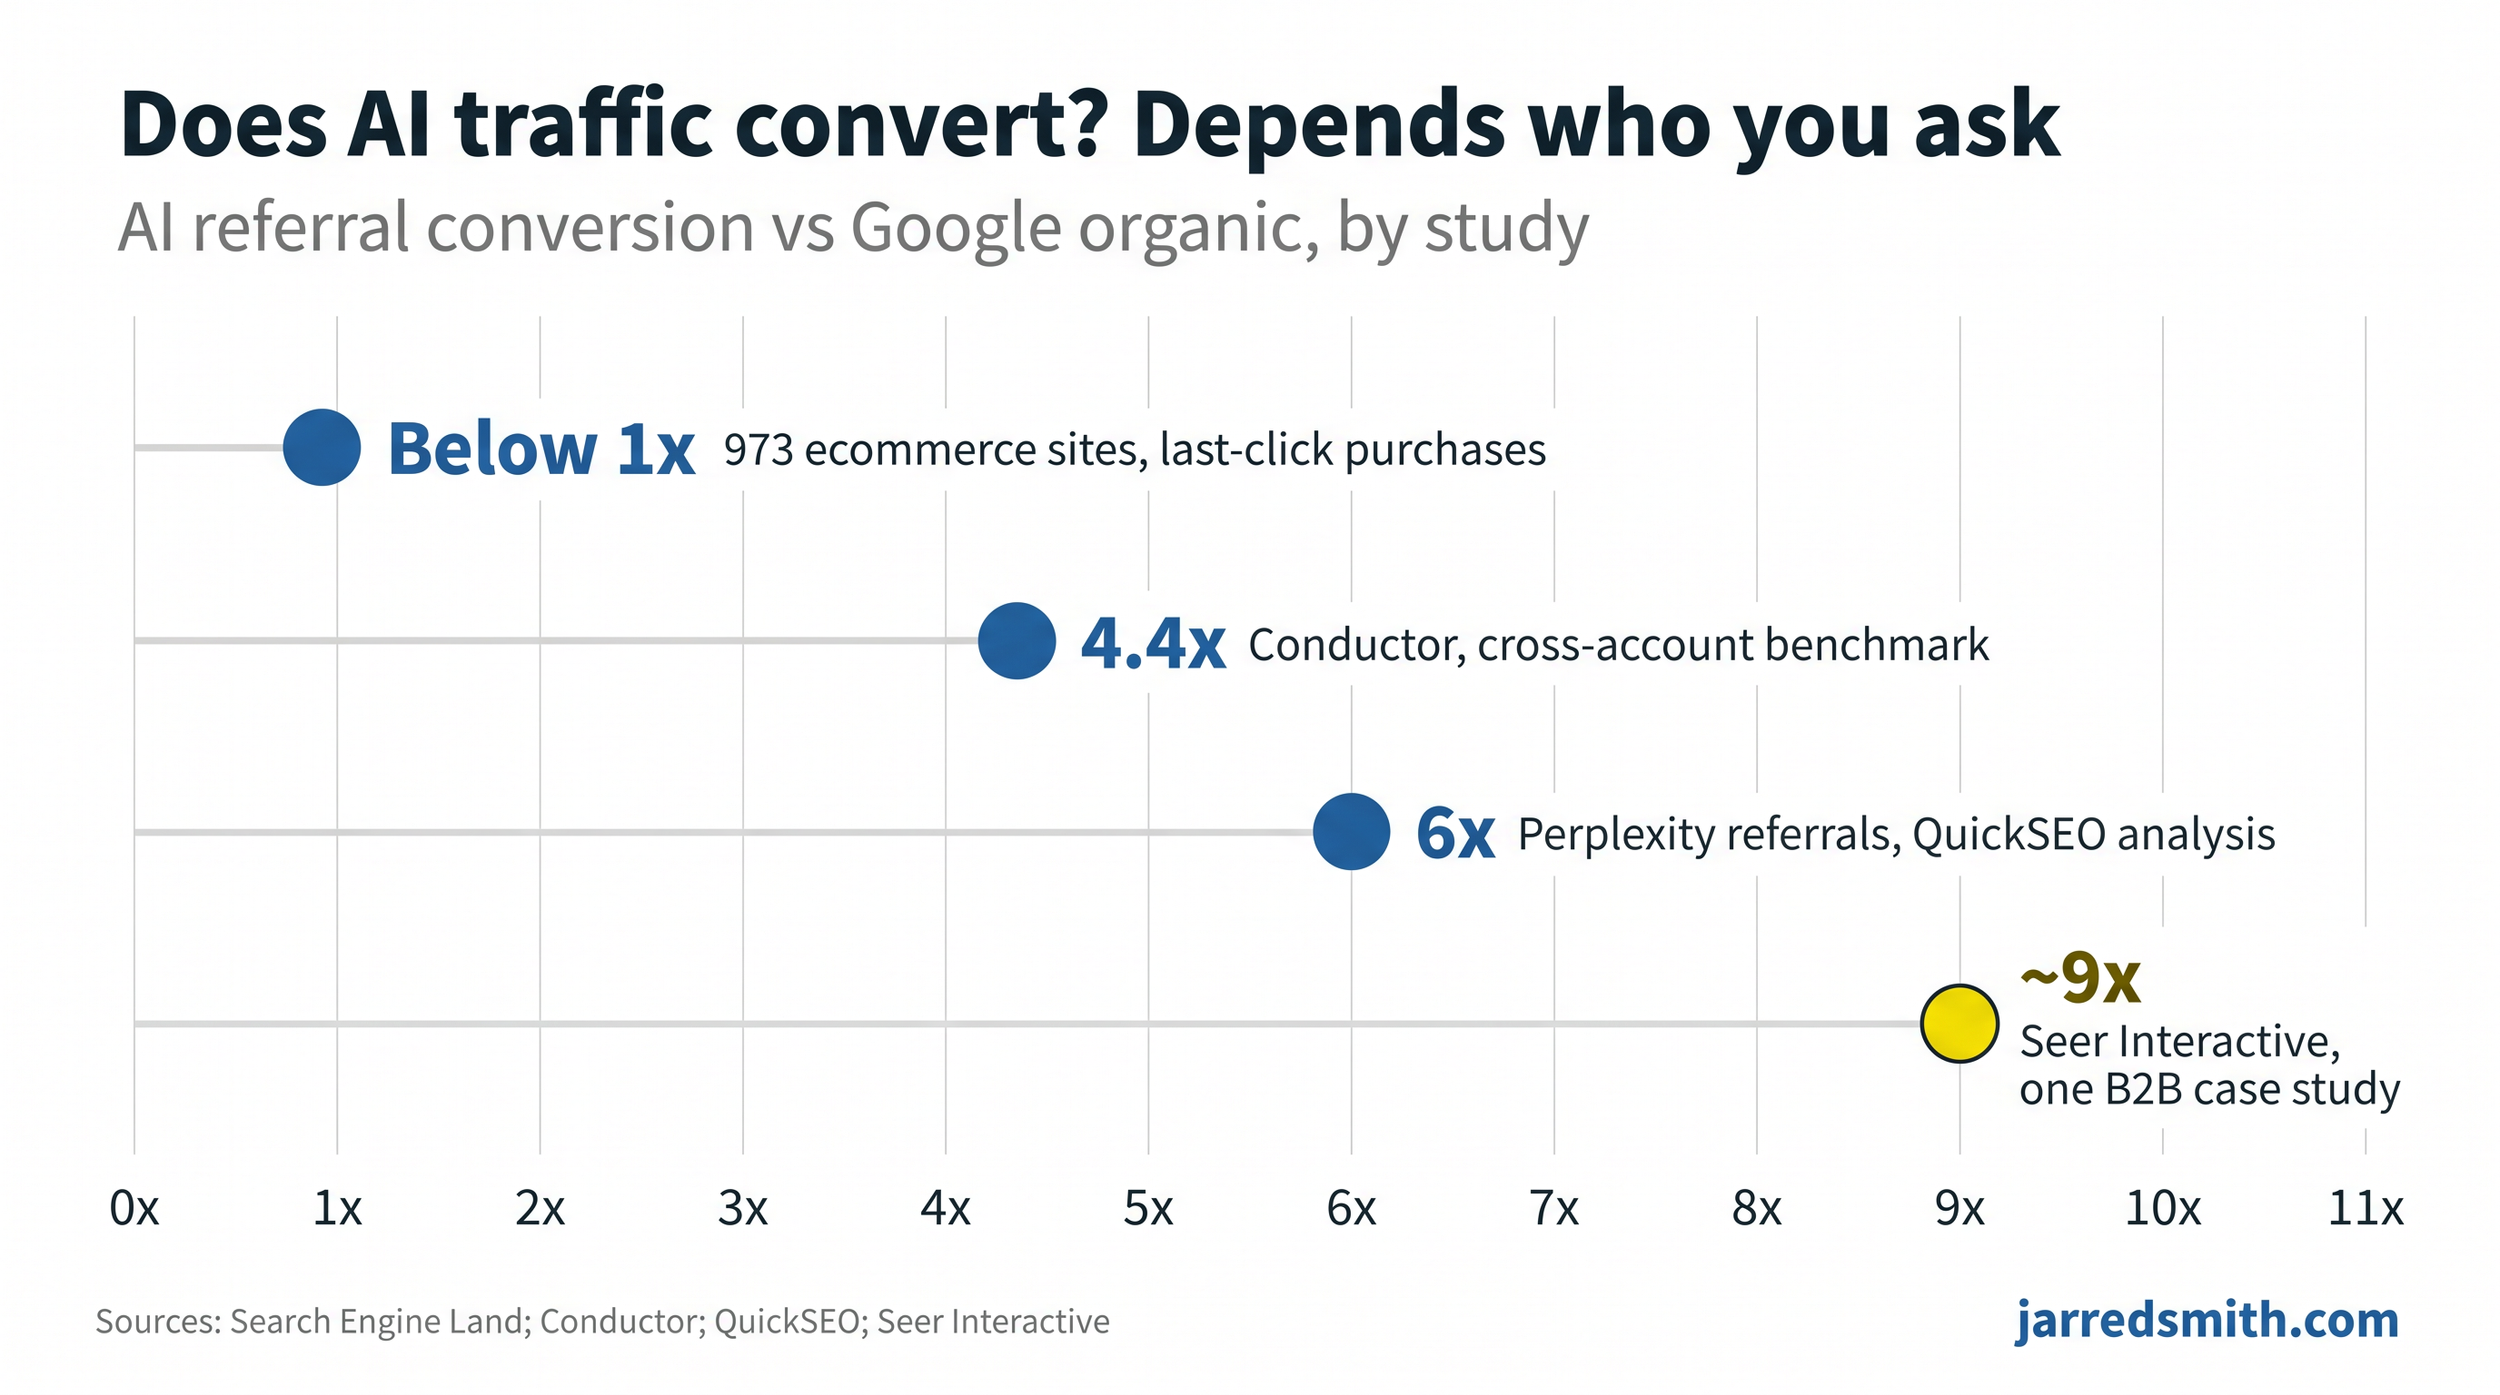
Conversion shows the same shape. A 973-site ecommerce analysis covering 20 billion dollars in revenue found ChatGPT referrals converting worse than organic search on last-click purchases. Conductor's cross-account benchmark found AI referrals converting 4.4x better. QuickSEO's analysis has Perplexity referrals at 6x, and a Seer Interactive B2B case study measured 16 percent against organic's 1.8, call it 9x. Same question, answers spanning below-parity to nine times better.
The instinct is to ask which study is right, but in this case, I’m not so sure that’s the right move. These teams aren't sloppy, and the disagreement carries information. Each study is a snapshot of a moving subject taken from a different angle with a different lens. Once you know the five settings, you can read any of these shots and know what it does and doesn't show.
Moving the number
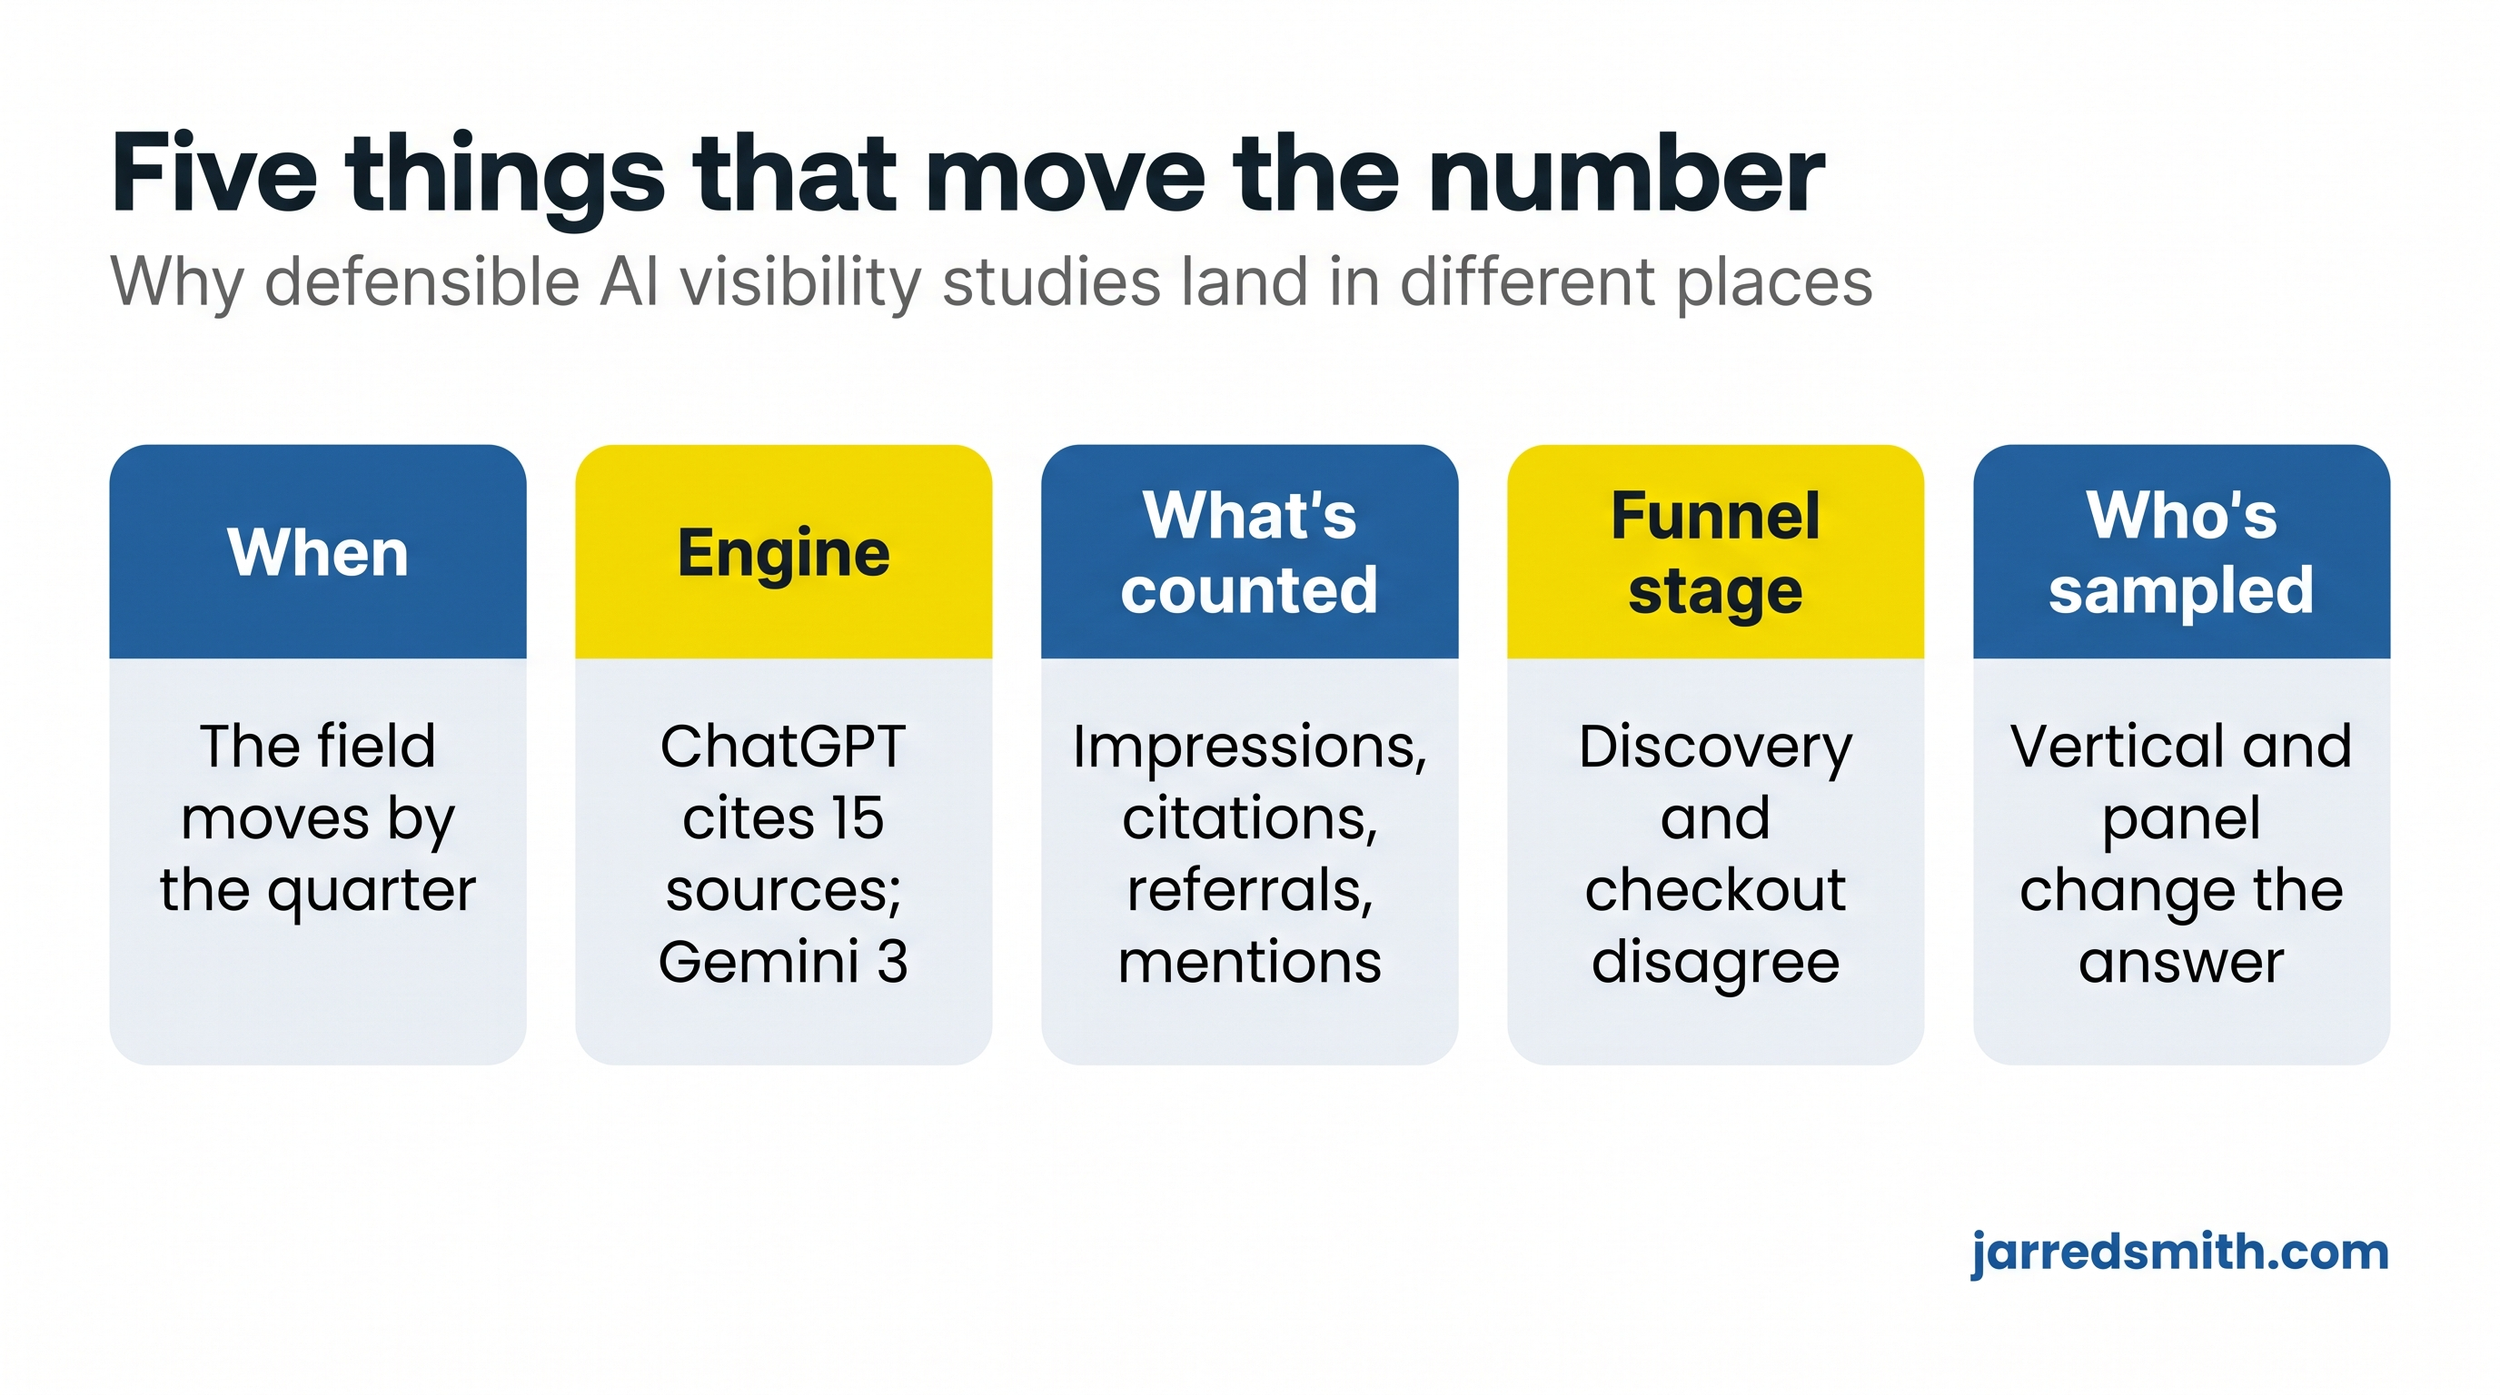
Start with when. This field moves fast enough that a study's date is part of its finding. Ahrefs measured the top-ten citation overlap at 76 percent in mid-2025 and 38 percent in early 2026 using the same method, so half the gap between any two overlap studies can be nothing more than the calendar (Discovered Labs). AI Overviews went from roughly a third of queries to about half in a single year. There's a subtlety inside this axis that trips people in the other direction, too. Digital Authority Partners ran one of the first controlled longitudinal studies, tracking 1,127 cited URLs across five engines in three waves over six weeks, and found the aggregate share of citations from outside the top-twenty organic results held steady around 60 percent while individual URLs churned underneath it, with only about a third of cited pages retaining their citation wave to wave. Aggregate numbers can hold still while your page's number swings, so a stable industry statistic and your own volatile dashboard can both be telling the truth.
Then the engine.Semrush's 126-million-prompt study found ChatGPT citing around 15 sources per response while Gemini cites 3, and only 36 brands in the entire dataset held top-100 visibility across all four major platforms. A "citation rate" measured on a 15-source engine and one measured on a 3-source engine were never going to match, and the divergence goes past arithmetic into behavior, since I found 93 percent different sources between two ChatGPT model versions on identical prompts, and Superlines has measured citation volumes for one brand differing by up to 615x between engines. Any study is mostly a study of whichever engines it sampled.
Third, what's being counted. Impressions, citations, brand mentions, referrals, and recommendations are five different quantities that get compressed into the word "visibility." The gap between them is where most misreadings live. GA4 sees only a fraction of AI-driven visits, something I found in my own referrer logs this spring, so referral-based studies structurally undercount. August then brought the sharpest version of this axis: new research covered in GPO's State of Search shows that being a cited source and being the recommended brand are separate outcomes, and an engine can cite your page while recommending your competitor in the same answer. The same roundup covers a 50,000-keyword study of Google's AI Mode where only 11.5 percent of advertiser domains were also cited on the queries they bought ads on, and just 2.3 percent of advertised URLs ranked organically for those terms. Paid, cited, and organic in AI Mode are close to three separate populations, so a study measuring any one of them tells you little about the other two.
Fourth, funnel stage. Walmart's Instant Checkout run produced two verdicts from one experiment: completing purchases inside ChatGPT converted at about a third the rate of clicking through to walmart.com, while the same traffic delivered roughly twice the new customers Walmart gets from search (I broke this down in July, data via Digital Applied). A study anchored to last-click conversion and a study anchored to acquisition will disagree about the same channel forever, and both will be right.
And fifth, who's sampled. The below-parity conversion finding came from ecommerce sites measured on last-click purchases. The 9x finding came from one B2B firm with a long consideration cycle. B2B buyers lean on AI for vendor research at rates consumer categories don't touch, verticals absorb AI crawling at wildly different intensities, and panel composition sets the ceiling on what any behavioral study can find, without ever appearing on the chart. I'd treat every number as unlabeled until you've checked whose behavior produced it.
The corridors
Once you read the studies through those five settings, you can stop hunting for the one true number and start planning inside realistic ranges. The reconciled table below is the one I keep, printed and withing reach, current through late August 2026.
How to pick your number
When the next study crosses your feed, or the next vendor deck lands with a stat that is seemingly doing a lot of work, five checks sort it in about a minute.
Check the date first, and discount anything older than two quarters unless it's longitudinal. Check which engines were sampled, and weight toward the ones your buyers use, since a Gemini-heavy study describes a different universe than a ChatGPT-heavy one. Find the denominator. A "citation rate" without a definition of citations-per-answer is a number I wouldn’t quite trust. Match the metric to your goal, cited for awareness, recommended for preference, converted for revenue, and don't let one stand in for another. Before you trust anyone's panel, run your own. SparkToro's volunteers found less than a 1-in-100 chance that ChatGPT repeats the same brand list for the same prompt, so a single-run screenshot proves nothing, but thirty of your best queries run monthly across the engines your customers use will beat every third-party study for the only question that matters, which is your own visibility. July made that process easier than it's ever been, with AI impression data landing in Search Console and an AI Citation Share metric arriving in Bing Webmaster Tools, which I covered when it shipped.
Industry studies give you ranges. If you want your own number, measured on your buyers' questions across ChatGPT, Gemini, Perplexity, and Claude, that's what my AI visibility audit produces.
The measurement era of AI search started this summer, and the cherry-picked single stat is going to look sillier every quarter it survives. Read the studies the way the people who ran them would want by looking at when it was dated, labeled, and bounded. My book asks why AI recommends some brands and ignores others; this is the companion question, how to know whether it's happening to you, and the corridor beats the cherry-pick every time someone asks you to bet a budget on the answer.
Jarred Smith is the author of Explainable: Why AI Recommends Some Brands & Ignores Others, an Amazon bestseller on AEO, GEO, and SEO. He's a marketing leader with nearly 20 years of experience across healthcare, public media, retail, and environmental services. Find him at jarredsmith.com.